
A few months ago I saw requests on social media for participants for a research study on bone density over the course of a competitive cyclist’s race season. Since it was just a quick jaunt down to Colorado State University in Fort Collins, I sent off volunteering to be a subject in the study and was accepted as a participant.
Wait, now why would bone density be decreased in cyclists? We’re crazy active and have crazy big leg muscles, right? That got my curious scientific mind thinking, and I realized that cycling probably doesn’t count as a weight bearing activity in the sense weight lifting would be… and competitive cycling eats away at you over the course of a season, mentally AND physically. And then aren’t we all about carbs? (Well, at least I am, though I do drink a lot of cow’s milk, which is actually not seemingly popular among cyclists.)
From the official research blurb:
Bone Mineral Density (BMD) has been shown to be drastically decreased in competitive cyclists. Lower BMD can lead to an increase in risk for broken bones, fractures and other serious skeletal system issues. This study’s purpose would be to asses the associated BMD changes over a competitive cycling season. A few things that we are also interested in looking at is dietary calcium intake and other physical activities cyclists engage in during the competitive season. A DEXA scan would be used to look at BMD, body fat %, lean body mass % and other body composition measures. The dietary analysis is a food log that would allow us to investigate calcium ingestion and other nutrient needs.
Today I had my first visit to CSU’s Human Performance Clinical Research Laboratory for my initial DEXA scan and to pick up my food log.
Dual-energy x-ray absorptiometry (DEXA or DXA, depending on source) is the standard for measuring bone mineral density (BMD) and to help diagnose osteopenia and osteoporosis. The scan itself is easy-peasy. You are position on a comfy table and aligned correctly. Then the scan begins and lasts about 8 minutes, and the table and x-ray emitter moves around to scan your whole body. The total radiation received is far less than a typical chest x-ray (or even hanging out in our thin-atmosphered mountains here in WY and CO!). Usually these scans are recommended for healthy women beginning at age 65, or younger if there’s suspicion or risk factors for osteoporosis.
Along with BMD, the DEXA scan also measures lean and not-so-lean body mass. Those results from today were not discussed with me as they did not want to influence the test subjects’ activities (oh us silly cyclists), but will be discussed at the August/Septemeber follow up appointment.
So how did I fare?

My T-score was -0.3, so slightly low for my age (30), but still within the normal range. I was kind of surprised at this, as I do intake a lot of calcium products and have been very to fairly active all my life. But… my mom has severe osteoporosis (she’s nearly a foot shorter than me and very very petite), and there is a genetic link with all of this, so that could be a factor (I have her small bone structure) along with the fact I’m a CYCLIST. Oh noes! Using the little graph thingy, if I continued on my current path, I wouldn’t be at an increased risk for thinning bones until age 55-ish.
T-score explained:
T score shows how your bone mineral density compares with women in their thirties, the peak bone density years. Scores of +1.0 are good. Numbers between +1 and – 1 show normal bone mineral density.
Scores between -1 and -2.5 indicate Osteopenia (thin bones).
Less than -2.5 indicate Osteoporosis (porous bones) , eg. – 2.7, -3.0 etc. And -3.0 shows greater Osteoporosis than does – 2.7.
BMD scores explained:
BMD gives your bone mineral density – the number of grams per centimeter of bone. Numbers of +1.0 or above are good.
The only BMD’s of mine that are not above +1 are thoracic spine, ribs, and arms. I have scrawny weak arms (yay cyclist), so not very surprised. Also, all my right sided BMD scores are higher than left side scores. Guess what? I’m right handed and right legged, so no surprise there!
The fun thing to see…
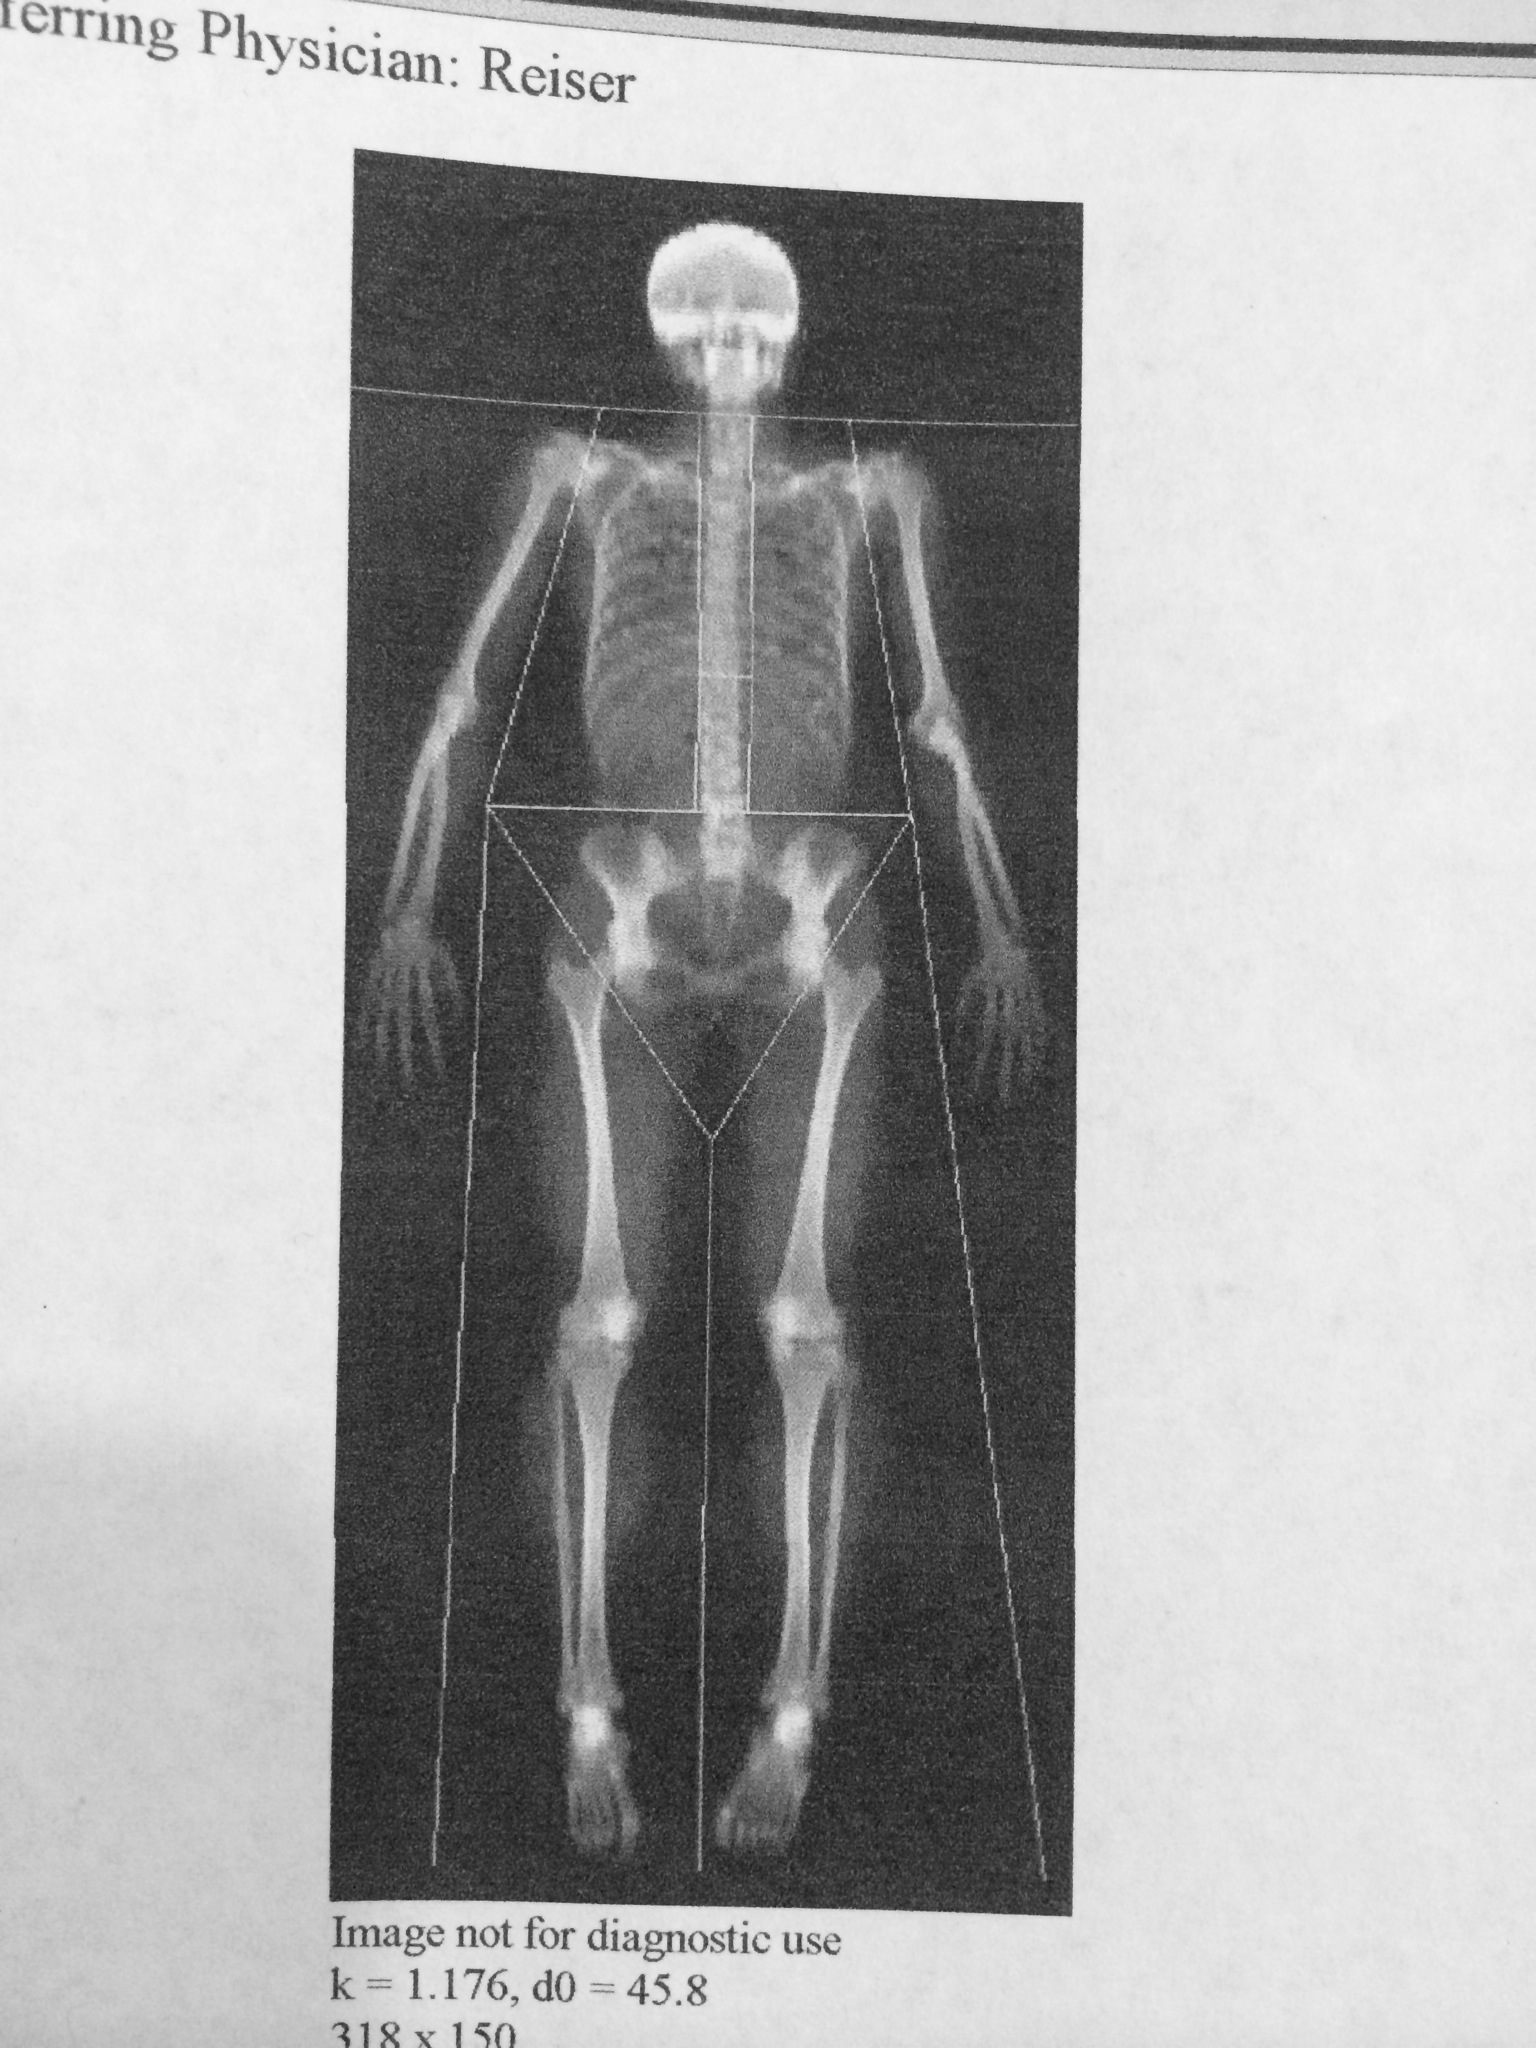
Seeing my skeleton is so cool!!!!
Next up to complete is a 4 day food log. I hate food logs because it makes me super conscious about what I am eating! And since I work nights, I’m sure there will be some weird eating times in there…
I’m super excited for my follow up appointment later this year to see how things changed and to learn all my full results. I’m super happy I had this volunteer opportunity and look forward to seeing the results of the study as a whole, as well.

Don’t take this as me pushing “the vegan agenda” but I’ve read articles about how the calcium in cow’s milk is not absorbed as well into the body for bone strength as other sources of calcium. Maybe look into it?
LikeLike
You and your vegan agenda! ARGHHH! 😛 😛 😛
I love me my moo milk. And moo yogurt. And green leafy veggies!
LikeLike